For more than a year there has been a clear trend: unemployment in the tech industry was climbing. The number of people with an #OpenToWork badge on their picture was climbing. There was something worse though, something that I hadn’t seen before: several months later, they were still looking. Something was wrong. Something had changed.
There are incredibly talented people with years or even decades of experience that are finding themselves spending anywhere from 9 to 24+ months to find new employment. People that are well established in their careers, people that have proven themselves, yet unable to find stable employment. People that just a few years ago would have had several offers within weeks, now unable to find even one after many months.
The strength and resilience of the job market has been collapsing.
A week ago I launched a poll on Mastodon asking a simple question: if you work in tech, are you employed, unemployed, or underemployed? From anecdotal observations, the issue was clear. I wanted to take it to the next step and start collecting data. Today I’d like to discuss the results of this poll, government unemployment data, tax law changes, and other forces that are reshaping employment.
Let’s start by taking a look at the numbers. If you’d like to skip ahead to the analysis, feel free. While analysing poll results and BLS data may be interesting, I understand if it seems a bit boring.
This poll, posted to Mastodon, offered three options. Here are the results:
- Unemployed: 25%
- Underemployed: 12%
- Employed: 63%
This paints a picture that is both clear and disturbing. With 37% of people in the field that are either unemployed or underemployed, the job market is in a disturbing state.
This is an obviously unscientific poll, and there are a wide number of reasons that the numbers won’t reflect reality perfectly. From self-selection bias to lack of regional specific filtering, these numbers aren’t a statistically valid sampling. What they are though, is a reliable pulse-check of the industry. A way to get a feel for how the industry is doing, even if the specific numbers aren’t entirely correct.
While it’s easy to assume that selection bias has resulted in inflating the numbers for being unemployed or underemployed, there are other factors to be considered. One example are those that are either semi-retired or retiring early, because of the difficulty of finding full-time roles. There are also those that have left the tech industry entirely, in search of full-time work.
Based on anecdotal information, the number of people that have left the field or workforce is far from trivial.
If you look at the headlines of news reports in the U.S., you will see unemployment listed at 4.6%1, though this is one of many different measurements. The Bureau of Labor Statistics publishes a variety of figures, the specific figure most people are familiar with is the U-32 count.
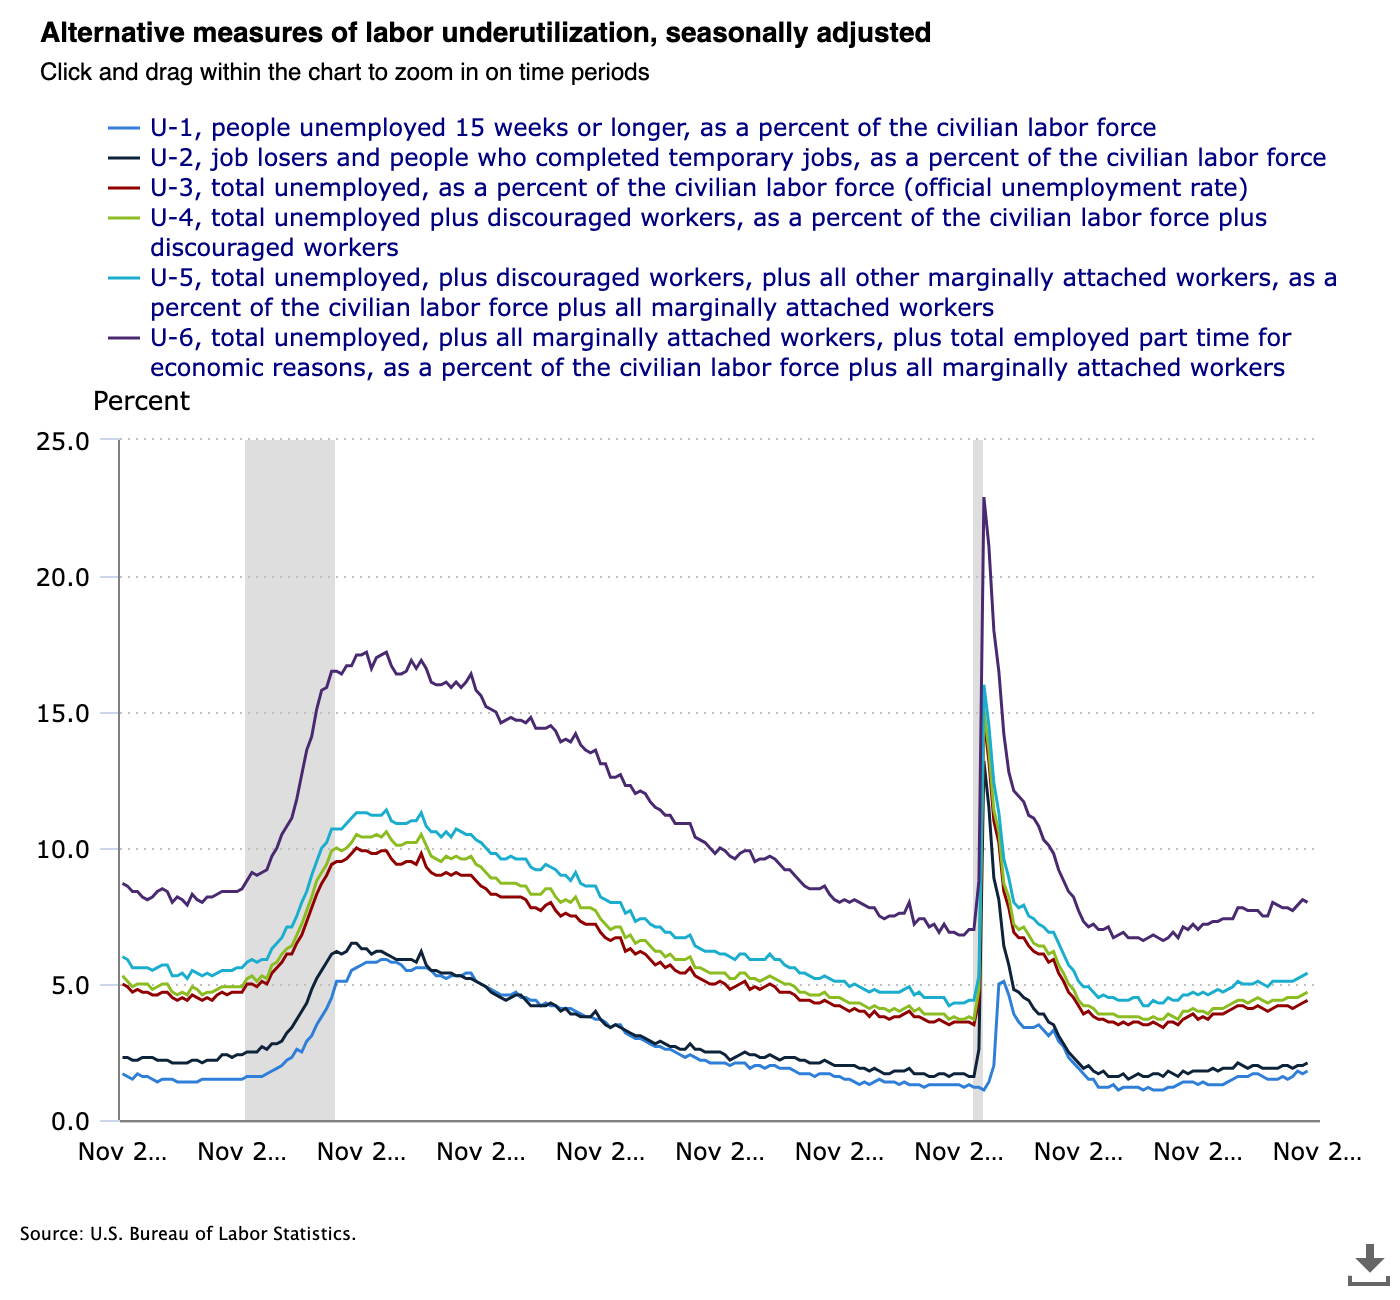
While U-3 is the standard count, it’s arguable that U-6 (currently at 8.7%) is the more insightful number, as it includes those that are unquestionably underemployed (working part-time), as well as those that have actively looked for a new job in the last 12 months but not in the last 4 weeks.
In our informal poll, the equivalent would be roughly unemployed + underemployed. That would be 37% - far higher than the 8.7% being reported. While we are comparing a tech-focused poll to the broader population, I suspect it would be unwise to assume that the difference is that large3.
Given that our unemployment numbers are so far off, perhaps there are other figures that are more useful.
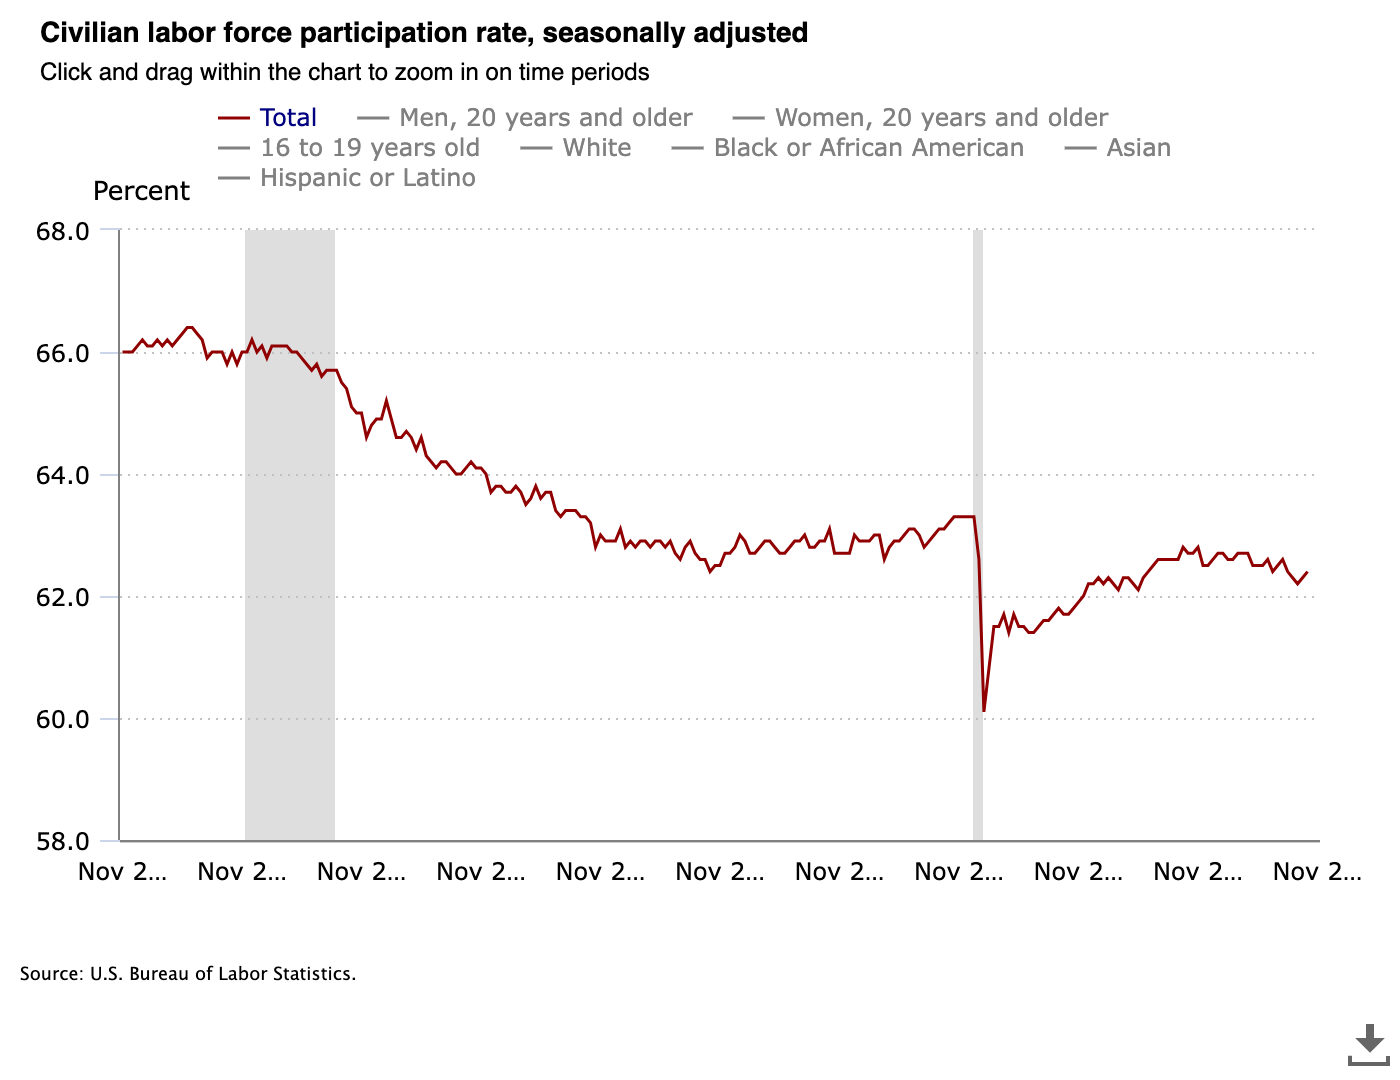
If we look at the labor force participation rate, we see that it’s currently at 62.5%. This is the percentage of people that are either employed or actively looking for employment. Comparing these charts, it’s clear that in the U.S., the number of people that are part of the labor force has been dropping since 2006 when it was 66.4%.
While the percentage of those unemployed is similar to the 2006 level, the percentage of those in the labor pool has dropped by almost 4%, and has yet to recover to pre-pandemic levels.
Currently, this means that 37.5% of the population is considered to be outside the workforce, and thus not counted in the unemployment numbers that everyone sees.
With these numbers in mind, I would like to take a few minutes to explore what these results mean, how we got here, and look a bit more into what’s going on.
Speaking to a recruiter at a pre-IPO startup4, they shared a few interesting details about their open roles. One of these was a fully-remote software engineer role, which had received over 8,000 applications. Another role, a very senior & specialised role had received over 250 applications, a role that a few years ago would have seen less than 20.
I have heard this from various recruiters, and has been building over the last three years or so. Hundreds of applications for roles that are specialised and require uncommon skills, roles that in the past I would have been excited to see two dozen applications. If you look at tech jobs on LinkedIn, you will see “Over 100 applicants” on nearly every one.
According to one hiring platform company, tech jobs are seeing the greatest number of applications per opening across all job roles5, with applications up 28% year over year6.
There are a number of factors in play with this massive increase:
- Unemployment & underemployment are likely at unprecedented levels.
- People are applying for roles that they are far over- or under-qualified for.
- Substantial increase in fraudulent applications.
This is creating a hiring nightmare for applicants and hiring managers: a flood of applications that drown the viable applicants, hiding them in a sea of noise.
We’re trying to hire a single developer right now and it’s been an absolute nightmare because of the amount of fraudulent applications and scammers. It’s crazy, and I don’t know how anyone gets anybody hired anywhere for a tech job anymore. - Mike Sager
While the supply of those looking seems to far exceed demand, there is indeed demand. There are roles open, though identifying the right candidates is getting harder, and filling roles is taking longer.
Time to fill roles is growing, with one source indicating that the average for a tech role is currently 51 days7. However the time for someone to find a new role is, at least anecdotally, substantially longer. Searches of 6 to 12+ months not being uncommon8 among those sharing their experiences on social media (and observations of unemployed status on LinkedIn).
Substantially increased competition, longer timelines, roles that will never be filled9, potential ageism10, AI-based screening11, longer and more complex interview processes – all in all, the experience of finding new roles in tech has become far worse in recent years.
In the U.S., there was a major change to tax law that impacted how research and development expenses are treated in federal income taxes. Critically, this massively changed how the costs of software development are handled. As part of the Tax Cuts and Jobs Act of 2017, signed by Trump in December 2017, and taking effect on January 1, 2022, updated how capitalization & amortization are calculated.
To simplify the critical part of this change, since 1954 R&D expenses (such as building software) could be fully expensed in the year the costs were incurred. After this change, these costs were broken up over 5 years for costs in the U.S., or over 15 years for foreign costs. This resulted in delaying the write-off of tech expenses, and increasing the tax burden for companies.
By increasing the tax burden on companies, it gives them another reason to reduce hiring and limit staff.
As of now, with the enactment of the OBBBA, this change has been partly repealed – at least for costs incurred in the U.S. This includes limited ability for certain firms to implement this change retroactively.
However, the damage is done.
I’ve written before about job losses from AI, analysing the likely impact over the years. Across the U.S., there were nearly 1.2M jobs cut, with 153,536 in the tech industry (17% more than 2024)12. There are estimates that as many as 55,000 layoffs are directly connected to AI, this is a complicated topic and the data isn’t clear.
One major challenge is that, from observing the market, there are likely multiple drivers for AI-related layoffs:
- Automation replacing jobs.
- Reduction in staff due to improved efficiency (real or perceived).
- Cost-cutting due to AI investments.
There is little doubt that AI is resulting in job losses, and reduced hiring13, and it’s the reduced hiring that’s likely having the largest impact. Given the negative media coverage that are associated with layoffs, partial or complete hiring freezes are able to largely stay under the media radar, and avoid unwanted attention, while allowing natural attrition to reduce headcount.
Given survey responses, it’s likely a safe assumption that the number of jobs lost to AI is predominantly in the form of roles that would have been opened otherwise.
The more time one spends looking at employment data, the more weakness that is seen. From the increasing number of people that have left the workforce, the reduced number of jobs being created (down 35% from last year14), the increasing timelines for those seeking employment to find a full-time role – it all points to a weakening economy. Furthermore, AI is leading to layoffs and eliminating jobs before they are opened.
I try to end my analysis on complex topics like this with useful advice, positive notes, or otherwise focusing on the silver lining that exists in most situations. In this case, I struggle to find something in this data that leads to optimism.
Good luck out there folks. There’s nothing else I can say.
While some will argue the accuracy of officially published figures from the U.S. Government, this is the data that’s available and the data that most people will see when looking at media reports. ADP has released data that indicates greater job losses than is being reported by official numbers, some in the U.S. Government believe that the official numbers are overcounting new jobs. I will not be arguing the accuracy of the data here, only that it doesn’t present a realistic image of the state of the tech industry or the experience of those that work in the industry. ↩︎
This is roughly defined as those that 16 or older, not working, and has actively looked within the last 4 weeks. BLS publishes detailed definitions. These are very much worth reviewing to better understand how they view and count employment and unemployment. ↩︎
Based on OEWS data published by BLS, in the U.S., approximately 4% of roles (6.95M of 154M roles) are directly tech-related roles. This is almost certainly undercounting, as it relies on specific job codes, which won’t account for those that are tech-adjacent, being entirely dependent on the health of the tech industry, but may not be coded as such. This data is from May 2024, which is the most recent available. Given the lack of recent data, and the limitations of how often the data is updated, it’s not useful to understand trends over shorter timelines. ↩︎
The company is a FinTech startup that you’ve likely encountered, though its name may not be familiar to those outside of the FinTech space. As such, roles at this company are unlikely to draw the level of attention that would be seen from companies such as Google, Meta, Amazon, etc. ↩︎
The top-level category that includes most tech roles, “computer & mathematical occupations” are seeing 65 applications per opening. Other sources place this figure as high as 83. It should be noted that this does include other job types. iCIMS Insights, December 2025. PDF ↩︎
BLS data indicates that across all those currently counted as unemployed, 24.3% have been unemployed for 27 weeks or more. As noted elsewhere, this is based on the 4.6% that are counted as unemployed, not including the 37.5% of the population that they no longer count as part of the labor pool. ↩︎
Greenhouse reported that 18%-22% jobs are ghost jobs that won’t be filled. Another report from LiveCareer lists 45% of HR professionals admit to regularly posting ads for ghost jobs. Some of these ghost jobs are being posted for SEO purposes. ↩︎
Those that are 55+ make up only 5% of applicants, 45-54 are 7%, and 35-44 are 10%. This supports concerned raised herein and elsewhere that an increasing number of people with substantial experience are leaving the field. I will leave further exploration of this issue as an exercise for the reader. iCIMS Insights, March 2025, Page 8. PDF ↩︎
This report from iCIMS is worth reviewing to see how AI is being used, and how companies and applicants perceive it, is worth reading. Determining the wisdom, value, and impact of this trend is left as an exercise for the reader. ↩︎
Challenger, Gray & Christmas, Challenger Report: 71,321 Job Cuts on Restructurings, Closings, Economy, Dec. 2025. ↩︎
Per a survey by the Federal Reserve Bank of New York, 23% of respondents indicated that they planned on reducing hiring due to AI. ↩︎
“Through November, U.S. employers have announced 497,151 planned hires, down 35% from the 761,954 announced at this point in 2024.” Challenger Report: 71,321 Job Cuts on Restructurings, Closings, Economy, Dec. 2025. ↩︎
